|
Hello all! I am a current AP Art History student and art fan at Albuquerque Academy. After seeing so many amazing pieces, I decided to make my own recreations using myself, my friends, and my family as models. Here are some of my favorite recreations I have done this year so far! Man in a Red Turban |


 |  |
Lamentation
by Giotto
 |  |
Hadrian's Wall
 |  |
Allegory of Law and Grace
by Cranach the Elder


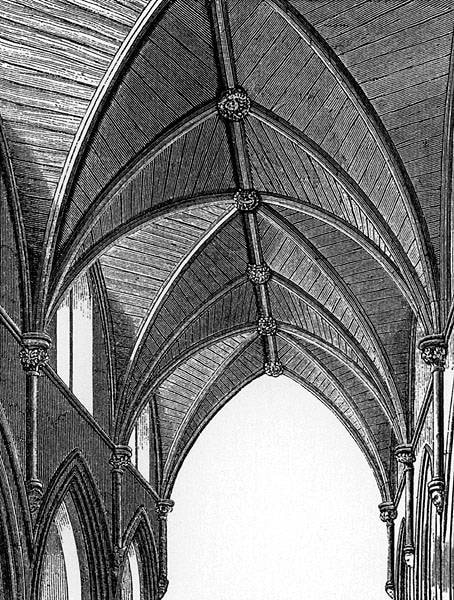
Quadripartite Ribbed Groin Vaulting
 |  |
Arnolfini Portrait
by Jan Van Eyck
 |  |
Seated Boxer
 |  |
Ecstasy of St. Teresa
by Bernini
 |  |
Self Portrait
by Durer
 |  |
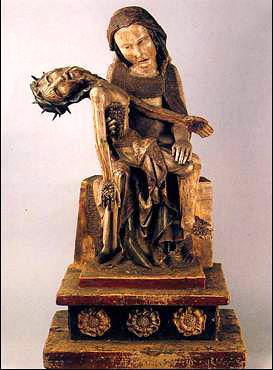
Röttgen Pietà
 |  |
Imagine you are on a game show and there are three doors that you need to choose between: A, B, and C. Behind one of these doors is a car, and behind each of the others is a random object. Let's say you choose door A out of A, B, and C. The game show host then shows you that the car is not behind door B. Now you have the the opportunity to switch to door C or stay with door A. Do you switch, or do you stick with door A? Below are the tree diagrams of the decisions, with the doors having a goat if they don't have the car.
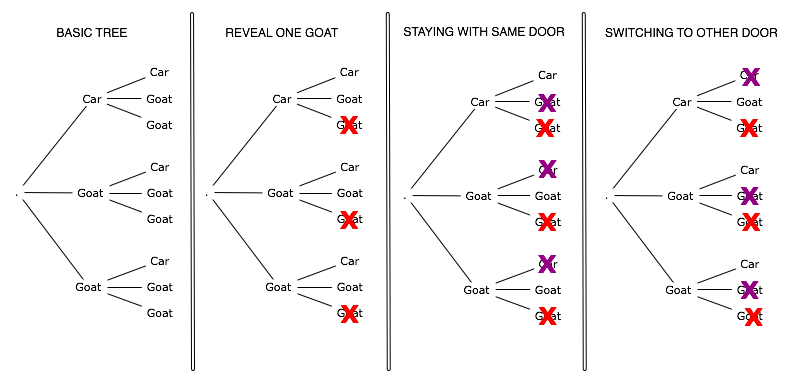
In the basic tree, it shows all the possible outcomes with each choice. At the beginning there is a 1/3 chance of getting a car behind the door you choose and a 2/3 chance of a car not being there. But then, the host reveals one of the goats, taking it away from the possible outcomes. You then are trying to decide if you should switch doors or stay with the same one. The red X's show the possibilities taken away from the host and the purple X's are the outcomes taken away when you make a choice. When the host reveals a goat, there is still a 1/3 chance that there will be a car behind the original door you chose and a 2/3 chance it isn't behind it. However, a 2/3 chance that a car isn't behind the door you chose is also a 2/3 chance that the car IS behind the other door. If you stay with the same door, there is a 1:3 chance that you would get the car, but if you switch doors there is a 2:3 chance you get the car. You double your chance of winning if you switch doors.
If you want to see a video explaining this phenomenon there is a great one below:
http://www.stayorswitch.com/explanation.php
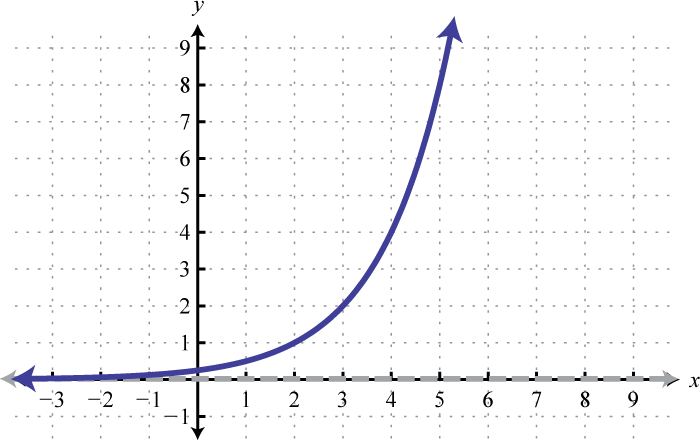
When watching Monica's Ted Talk, you really get an understanding for how fast information spreads. It was because of this lightning quick spread that she became a household name in the first place. To visualize just how fast information can spread, you want to look at an exponential graph. When graphing exponential functions, you can see that the information increases so quickly it is impossible to get everything to fit on a normal sized graph. For example, if you say that in one hour three people get information and they pass it onto three more people the next hour, who in turn each pass it on to three other people, the number of people with information goes form 3 to 243 in about 5 hours. This is because it is increasing exponentially. Then, if you make it so information is passed at a more realistic amount of time, say every 15 seconds, 243 people have seen the information in only 105 minutes (1.75 hours). Now lets say that 100 people saw the information at first and passed it on to 100 more. That would make it so that 10,000 people would have seen it in an hour, 1,000,000 in two hours and 100,000,000 in three. That is an insane amount of people in such a short period of time and you can easily see how this spread of information could lead to the downfall of someones career or life. As time passes, the number of people who have seen the information keeps increasing by larger and larger amounts. If the graph is adjusted, the values increase by the equation x=y^x (y to the x power). In this equation, y is being raised to the x power so it is increasing exponentially. Information travels extremely fast, and its important to remember that and pay attention to what you are putting out in the world.

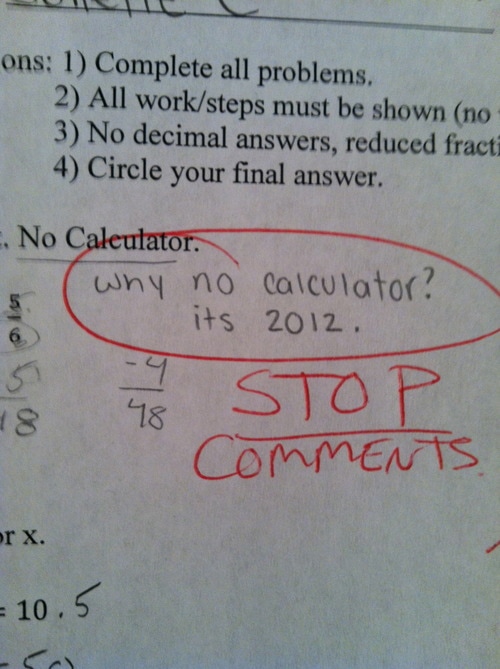
| Calculators are a tool that can be extremely helpful in math. They can be used for multiplication, addition, algebra, etc, but did you know that your calculator can help you know if something is an identity or not? Well it can, and just with a few simple steps. All you do is type the expression into the Y1 slot, then graph it. (Just make sure you're is set in the right mode first!) Then you read the graph. For example, if you look at the graph and it is a straight line at Y=1, then you now know that your trig expression can be simplified to one. To determine if something is an identity, you plug the left side of the equation into Y1 and then plug the right side in Y2. Next, you click Zoom and then go down to ZTrig. Once you click on this the equation is graphed. If it is an identity, then the two lines would be in exactly the same place . If not, you would be able to see two different lines. Lets take this idea and have some fun! Lets try this with an equation that is not and identity: tan2 x = 1 - sin2 x If you plug tan2x as Y1 and 1-sin2x as Y2 and graph it, the graphs do not line up. If you look at the first picture, you can see this to be true. And now lets do and example with an equation we know to be an identity: sinx=1/cscx If you plug this in the same as we did before you find that only one line is visible. This confirms that the equation is an identity. The second photo shows this to be true. Notice the difference between the first and second photo. Identities only have one line visible. While this is extremely helpful, we can't use it to prove that something is an identity.The reason we aren't able to actually prove an identity using our calculator is because the calculator work is not actually a proof. Trigonometric proofs are done algebraically. In this case, we are only checking our work. |   |
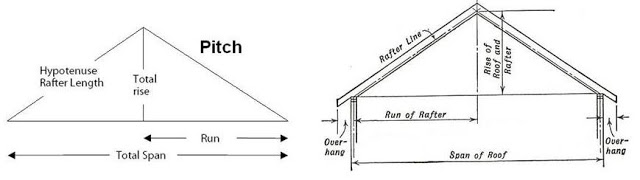
The pitch of a roof is an important concept, especially in building houses. The pitch refers to the slope of the roof, and to the tangent of the angle the surface to the horizontal. That means that the pitch can be thought of as rise over run ( the formula for slope). Because the pitch of a roof can be thought of in terms of slope, an architect who wants a 10/20 inch pitch roof would then have the roof rise 10 inches for every 20 inches horizontally. The picture above shows how all of this relates to trigonometry. If the roof is split in half, then you would have two triangles. You can then use the measure of the angles and use sine, cosine or tangent (depending on what you have been given), or the pythagorean theorem to calculate the hypotenuse (or rafter length). Many of the trig functions can be applied in order to find different lengths of the roof. Trig is still a huge part of our lives today, even if we don't know it.

Recently, I read an article about the perseverance of four olympic athletes (I will put the link for the article below). I learned about the struggles of a fencer from the Bronx, and how the first american to win the gold in Judo had to deal with the sexual abuse in her past. From Lopez Lomong, who was imprisoned in a horrible camp after being kidnapped by soldiers, to Jillian Potter who broke her neck in a game and was told she could never play again, I was struck by the perseverance and hard work these athletes put in to get to such an amazing place. They were able to overcome their past, and went on to do amazing things. It really gives me hope for myself and others in the future. If they can do it, why can't we? We all have the spirit of perseverance in us, and we are all capable of greatness, no matter what our lives may be like at this very moment.
Link for the article I read:
http://www.upworthy.com/when-life-hit-them-hard-these-4-olympians-persevered-and-hit-back-even-harder?c=sr1&sr_source=lift_facebook
Link for the article I read:
http://www.upworthy.com/when-life-hit-them-hard-these-4-olympians-persevered-and-hit-back-even-harder?c=sr1&sr_source=lift_facebook

Graphing exponential functions on semi-log graph paper makes all the difference in the world. In my previous blog post, I talked about graphing exponential functions on regular graph paper. Using the regular paper, only a few point could fit on the graph. not really giving a good view of the exponential functions. Using semi-log graph paper, I was able ta graph almost all of my points. The semi-log provided a good visual of the lines the points created and fit everything I wanted to graph. Just look at the picture above. This is just a graph I found online, but you can see how many points were able to be graphed, and how the slope of the points is easily visible. To learn more about semi-log graphing, I watched a video that had some very helpful information (the video will be below). In it, I learned an awesome poem about how semi-log graphs work. Here it is:
The numbers with a "1"
from low to high
are what you count from
and what you count by
This poem means that you would move up the amount of the number that has a one in it. For example, if the number was 1, you would move up by 1 on every line, so the graph would go from 1 to 2 to 3 etc. Using this method, you could also graph really large numbers and decimals. Using decimals, the lines would increase by decimals, so they could increase by 0.1, 0.01, 0.001 etc. The semi-log graph is set up in a way where you could put all kinds of decimals on the graph, and have them be visible. Now, when looking at the graph, you can see that the spaces between the lines aren't even. What is actually happening though is a repetition of thicknesses. On the graph, the distance between 20 and 10 is the same as 2 and 1, as 200 and 100,and as 0 .0002 and 0.0001. These distances are all proportional and have a 100% increase in distance. However, the distance between 9 and 10, or 90 and 100, would be only an 11% increase. Using the semi-log graph, it is possible to graph all sorts of numbers, and the uses and your creativity are limitless.
Author
Isabel Benak
Archives
September 2018
January 2018
December 2017
March 2017
February 2017
January 2017
October 2016
September 2016
August 2016
March 2016
February 2016
January 2016
November 2015
October 2015
September 2015
 RSS Feed
